Car accidents are, unfortunately, an everyday occurrence on U.S. roads, impacting thousands of lives daily. But how many crashes actually happen each day? And what are the main causes behind them?
Understanding the latest statistics, accident trends, and legal updates can help drivers stay informed and take proactive steps to protect themselves. With 2025 bringing new safety laws, advancements in vehicle technology, and evolving driving behaviors, this guide breaks down the most up-to-date facts about car accidents per day—backed by trusted sources like the National Highway Traffic Safety Administration (NHTSA) and the Insurance Institute for Highway Safety (IIHS).
Daily Car Accident Statistics: How Often Do Crashes Occur?
Car accidents are sadly very common in the United States. Recent data provides a clear picture of the frequency of these accidents:
- In 2022, there were approximately 5,930,496 police-reported crashes, averaging about 16,248 car accidents per day, according to the Bureau of Transportation Statistics.
- These daily accidents resulted in around 117 fatalities, totaling 42,795 deaths for the year, per NHTSA’s 2022 estimates, and approximately 6,849 injuries per day, based on an estimated 2,500,000 injuries annually from the National Safety Council (NSC).
- The number of daily accidents has shifted over recent years. In 2019, there were about 15,616 daily crashes (5,700,000 total), dropping to 12,603 per day in 2020 (4,600,000 total) due to reduced travel during the COVID-19 pandemic. Preliminary IIHS data suggests that by 2024, this figure may have climbed to around 16,500 daily accidents, reflecting increased travel and persistent distracted driving challenges, with final 2025 numbers still pending as of February 27, 2025.
These statistics highlight the ongoing risks of the road, but understanding when and where accidents happen most frequently can help you minimize the chances of a crash.

When and Where Do Most Car Accidents Happen?
The experts know that some situations are riskier than others. Here’s what you need to know about peak crash times and high-risk locations:
Most Dangerous Times for Car Accidents
- Rush Hour: Crashes peak between 7-9 AM and 4-7 PM due to heavy congestion, with fatal accidents often highest from 6 PM to 9 PM, according to NHTSA’s crash timing analysis.
- Weekends: Saturday nights and early Sunday mornings see a noticeable spike, often tied to drunk driving, as highlighted by the CDC.
- Seasonal Trends: Summer months like July and August bring more fatal crashes due to increased travel and reckless driving, while winter sees a rise in weather-related incidents, per an IIHS seasonal study.
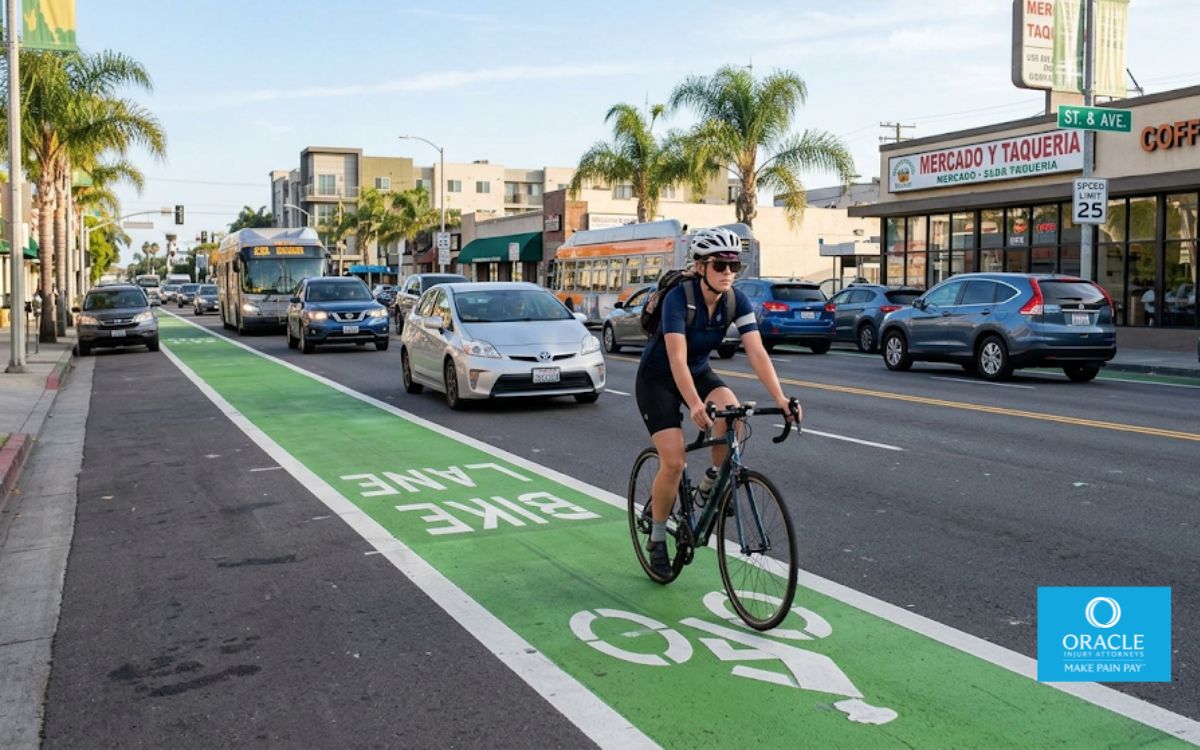
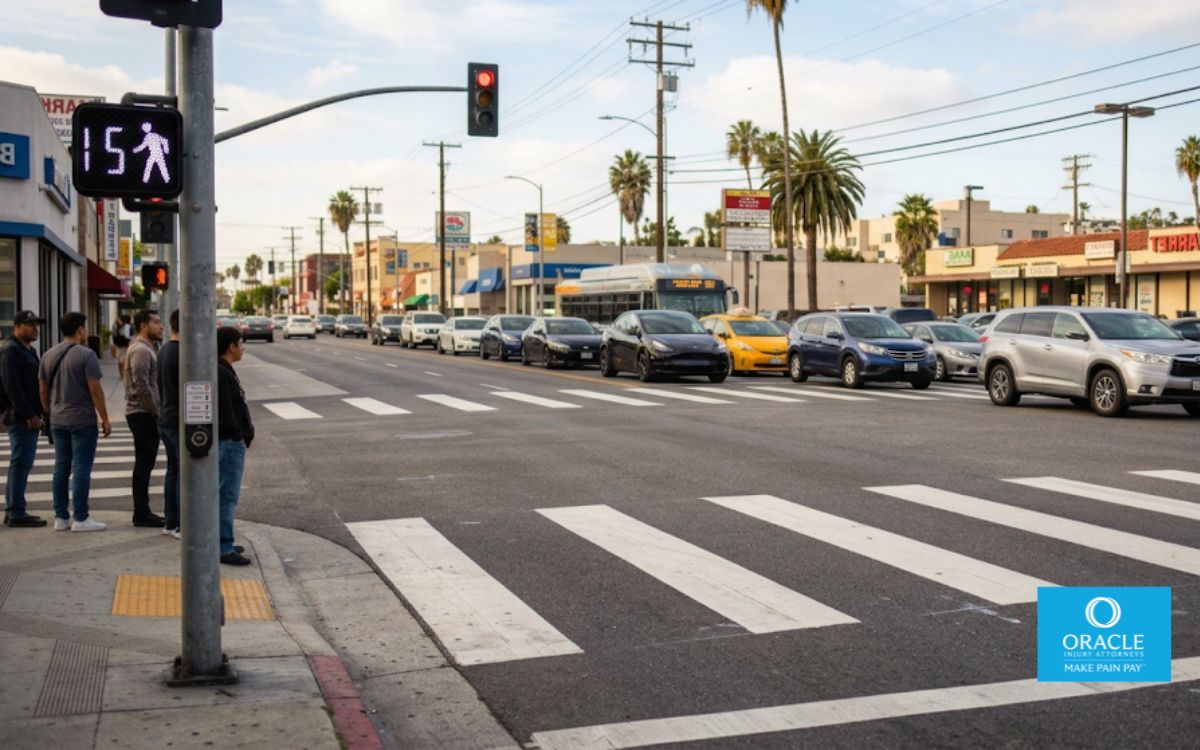
Where Do Most Car Accidents Happen?
- Intersections: Over 50% of fatal and injury crashes occur at or near stoplights and stop signs due to speeding, misjudgment, or distracted driving, as reported by the Federal Highway Administration (FHWA).
- Highways & Freeways: High speeds and dense traffic contribute to about 30% of fatal crashes, contrary to higher estimates, based on NHTSA’s data.
- Rural Roads: Less crowded but more deadly, rural roads have higher fatality rates due to limited visibility, sharp turns, and delayed medical response. Learn more about where most crashes happen.
Top Causes of Car Accidents in 2025
Despite technological advancements, human error remains the leading cause of car accidents. Here are the most common reasons crashes occur:
- Weather Conditions: Rain, fog, and ice make roads more dangerous, leading to increased accidents.
- Distracted Driving: Despite stricter laws, phone use while driving—including texting and social media—remains a top cause of accidents.
- Speeding: Exceeding the speed limit reduces reaction time and increases crash severity.
- Drunk & Drug-Impaired Driving: Even with new DUI laws and increased enforcement, impaired driving remains a major issue.
- Reckless Driving & Road Rage: Tailgating, aggressive lane changes, and failure to yield contribute to thousands of accidents annually.

The Impact of New 2025 Laws on Road Safety
New regulations aim to reduce the number of daily car accidents by holding drivers accountable and promoting safer driving habits. Some key legal updates in 2025 include:
- Stricter Distracted Driving Laws: Higher fines and new hands-free device mandates in many states.
- Tougher DUI Regulations: Lower BAC limits and increased penalties for first-time offenders.
- Speed Limit Adjustments: Speed limits in high-risk zones have been modified to prevent severe crashes.
- Mandatory Safety Features: Some states now require new cars to include automatic emergency braking (AEB), lane departure warnings, and pedestrian detection as standard features.
These changes reflect a growing effort to reduce accidents and make roads safer for everyone.
The Role of Technology in Reducing Car Accidents
Advancements in vehicle safety technology are making a significant impact on accident prevention. Some of the most promising innovations include:
- Automatic Emergency Braking (AEB): Detects obstacles and applies brakes to prevent collisions.
- Lane Departure Warning Systems: Alerts drivers if they unintentionally drift out of their lane.
- Adaptive Cruise Control: Adjusts speed automatically to maintain a safe following distance.
- AI-Powered Traffic Monitoring: Smart traffic signals and AI-driven road management help reduce congestion-related crashes.
While these technologies are improving safety, driver responsibility remains the most important factor in accident prevention.

What to Do After a Car Accident in 2025
If you’re involved in a car accident, knowing what to do can make a huge difference in protecting yourself and securing fair compensation. Follow these steps:
- Check for injuries and call 911 if anyone is hurt.
- Move to safety if possible, but never leave the scene.
- Call the police and file an official accident report. Many states now allow digital accident reporting via mobile apps.
- Exchange information with other drivers but avoid admitting fault.
- Document the scene—take photos, collect witness statements, and keep track of medical visits.
- Contact an attorney if you’ve suffered injuries or vehicle damage—legal guidance ensures you receive the compensation you deserve.
For more comprehensive guidance, check our article on steps to take after a car accident in California and what to do after a car accident that’s not your fault.
How Oracle Law Firm | Accident & Injury Attorneys Can Help You
At Oracle Law Firm | Accident & Injury Attorneys, we specialize in car accident claims and have helped countless victims recover the compensation they need after a crash. Whether you’re dealing with medical bills, lost wages, or emotional distress, we’re here to fight for your rights.
Why Choose Oracle Law Firm?
- Experienced Legal Team: Decades of experience handling car accident cases.
- Proven Track Record: We’ve secured millions in settlements for our clients.
- No Upfront Fees: You don’t pay unless we win your case.
- Personalized Representation: Every case gets the attention it deserves.
If you or a loved one has been injured in a car accident, don’t wait. Contact Oracle Law Firm today for a free consultation.

Final Thoughts
Car accidents happen every day, but by staying informed, practicing safe driving habits, and understanding your legal rights, you can reduce your risk and protect yourself on the road.
With new laws, emerging technologies, and shifting accident trends in 2025, it’s more important than ever to stay educated about road safety. And if you ever find yourself in a crash, Oracle Law Firm is here to help you navigate the legal process and fight for the compensation you deserve. For more information or a free case evaluation, reach out to Oracle Law Firm today.
Frequently Asked Questions
What should I do immediately after a car accident?
After a car accident, prioritize safety by checking for injuries and calling 911 if needed. Move to a safe location if possible but never leave the scene. Call the police to file an accident report, as this can be crucial for insurance and legal purposes. Exchange contact, insurance, and vehicle details with the other driver, but avoid admitting fault.
Take photos of the accident scene, vehicle damage, and any visible injuries. If there are witnesses, get their contact information. Seek medical attention, even if you feel fine, as some injuries may not be immediately apparent. Finally, notify your insurance company and consider consulting a car accident lawyer if you experience significant damages or injuries.
Do I need to call the police after a minor car accident?
Yes, it’s generally a good idea to call the police after a minor car accident, as an official report can help with insurance claims and protect you legally. In some states, reporting an accident is legally required if there are injuries or property damage above a certain amount.
Even if the damage seems minimal, hidden issues or injuries may arise later. A police report provides an unbiased account of the accident, which can prevent disputes over fault. If officers do not come to the scene, you can often file a report at a local police station or through an online system.
How do I prove the other driver is at fault?
Proving the other driver is at fault requires gathering strong evidence, including a police report, witness statements, and photos or videos of the accident scene, vehicle damage, and road conditions. Traffic laws and violations play a key role, so noting if the other driver ran a red light, was speeding, or was distracted (e.g., using a phone) can support your case.
Surveillance footage, dashcam recordings, and accident reconstruction experts can also help establish fault. Additionally, insurance investigations and admissions of fault by the other driver, even informal ones, may serve as evidence in your claim. For more information, see our guide on how to dispute a car accident fault effectively.
What if the at-fault driver doesn’t have insurance?
If the at-fault driver doesn’t have insurance, you may still have options for compensation. First, check if your auto insurance policy includes uninsured motorist (UM) coverage, which can help cover medical expenses and vehicle repairs. If you don’t have UM coverage, you may be able to file a claim under your personal injury protection (PIP) or collision coverage, depending on your policy.
Another option is pursuing a lawsuit against the at-fault driver, though collecting damages can be challenging if they lack assets. Consulting a car accident attorney can help you explore legal options and maximize your chances of recovering compensation.
How long do I have to file a personal injury claim after a car accident?
The time you have to file a personal injury claim after a car accident is governed by the statute of limitations, which varies by state. In most states, you typically have 2 to 3 years from the date of the accident to file a claim. However, certain circumstances, such as the discovery of an injury after the accident or a government entity being involved, may affect this timeframe.
It’s crucial to act quickly, as evidence can deteriorate and witnesses may become harder to reach over time. Consulting a personal injury lawyer soon after the accident can ensure you meet all necessary deadlines and protect your legal rights.
What types of compensation can I receive after a car accident?
After a car accident, you may be entitled to several types of compensation, depending on the severity of your injuries and the circumstances of the crash. Common forms of compensation include medical expenses (for current and future treatment), lost wages (for time missed from work), property damage (to repair or replace your vehicle), and pain and suffering (for emotional distress and physical pain).
In cases of severe injury, you may also be eligible for compensation related to disability, loss of quality of life, or permanent impairment. If the at-fault driver was particularly negligent, punitive damages might also be awarded to punish their behavior. Working with an experienced attorney can help ensure you receive the full compensation you deserve.